HES-SO VALAIS 2026 / GROUP 14 / 64-61 DATA CYCLE / USE CASE 02 — Group 14, HES-SO Valais
Turning raw IoT signals
into apartment intelligence
An end-to-end data platform built for two smart apartments in Valais, Switzerland. 470,000+ raw sensor files turned into a clean dimensional model, four Power BI dashboards with row-level security per tenant, and two ML models — deployed on a single VM in one self-contained installer.
JSON / CSV / MySQL
sources
470k files
bronze
15M+ rows
silver
star schema
gold
dashboards
bi / ml
the dashboards
Six glimpses of the Power BI report
Six tabs, one dimensional model. Per-tenant row-level security, a custom Python visual for the weather forecast, KNIME prediction overlays on the energy and presence dashboards.
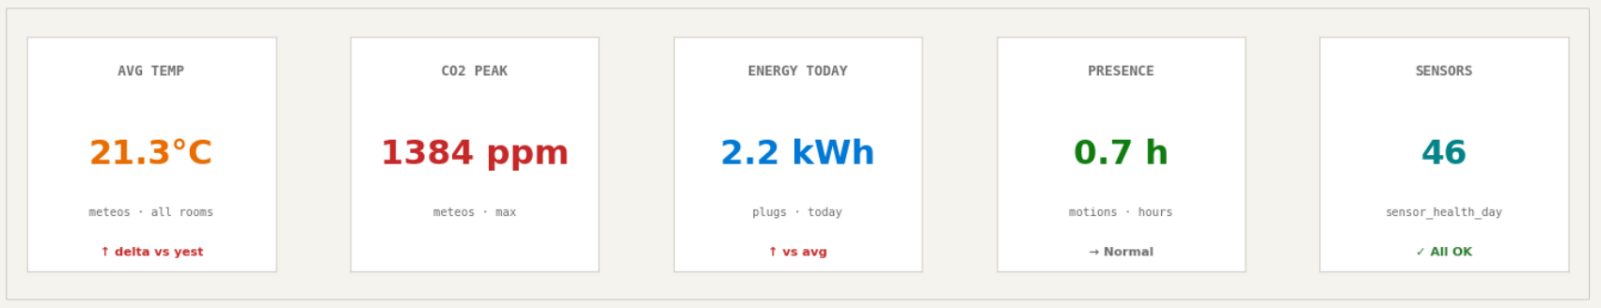
Overview — KPI tiles
Five headline metrics at a glance: avg temperature, CO₂ peak, energy used today, presence hours, sensors online. Colour-coded trend per tile.
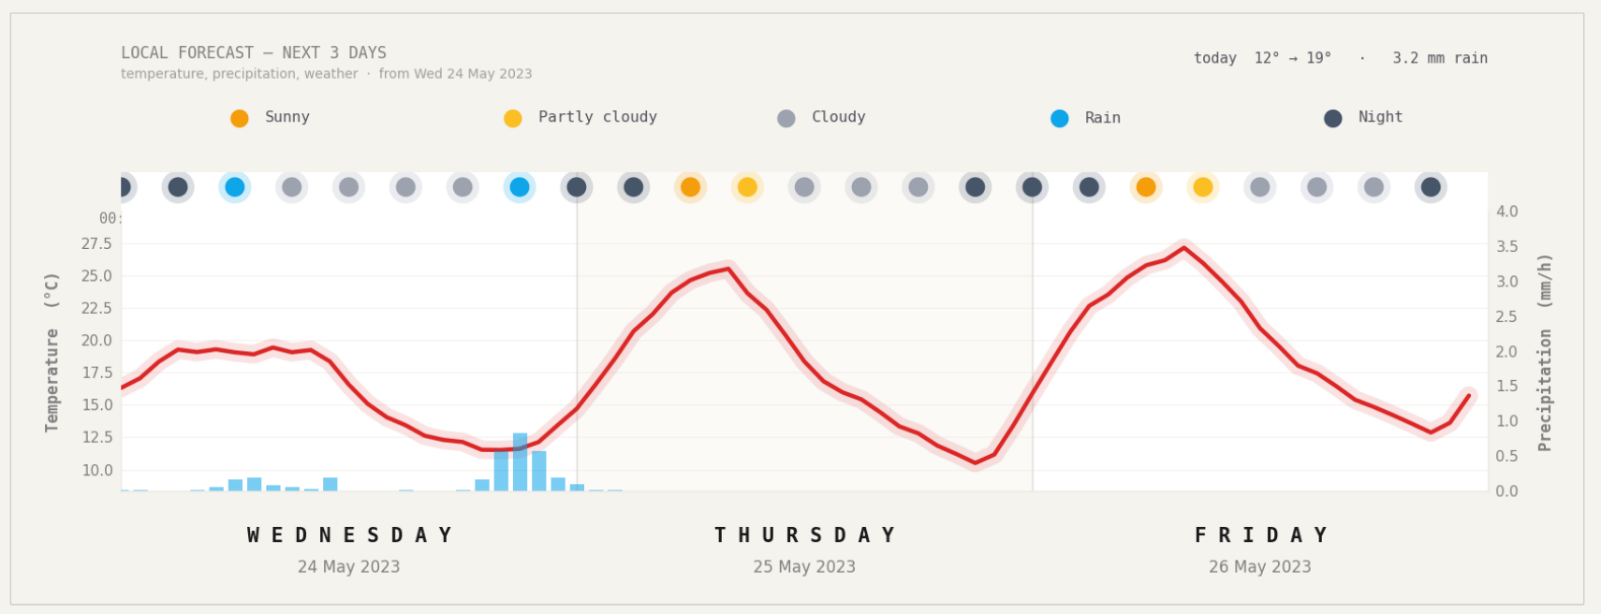
Energy — 3-day weather forecast
Custom Python visual mounted directly in Power BI. Temperature curve, precipitation bars, weather state dots — feeds the consumption-prediction context.
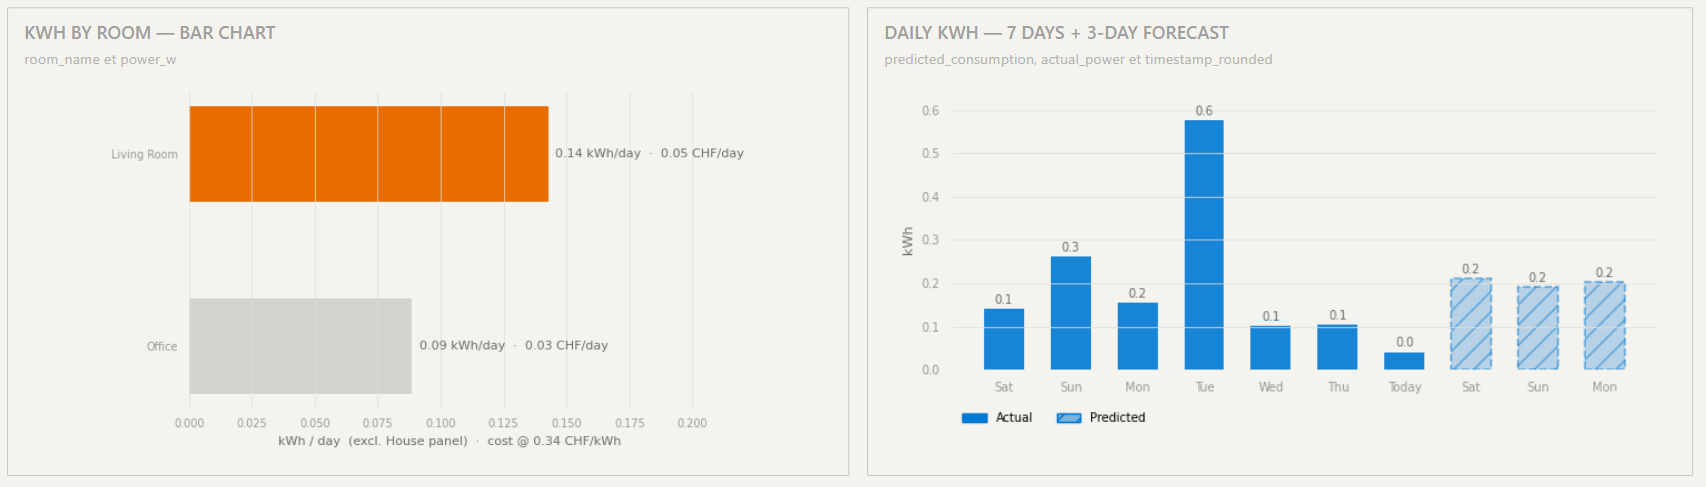
Energy — actual vs predicted kWh
Seven days of measured consumption plus a 3-day KNIME forecast (hatched bars). CHF cost on every bar, computed from the Oiken Sion tariff.
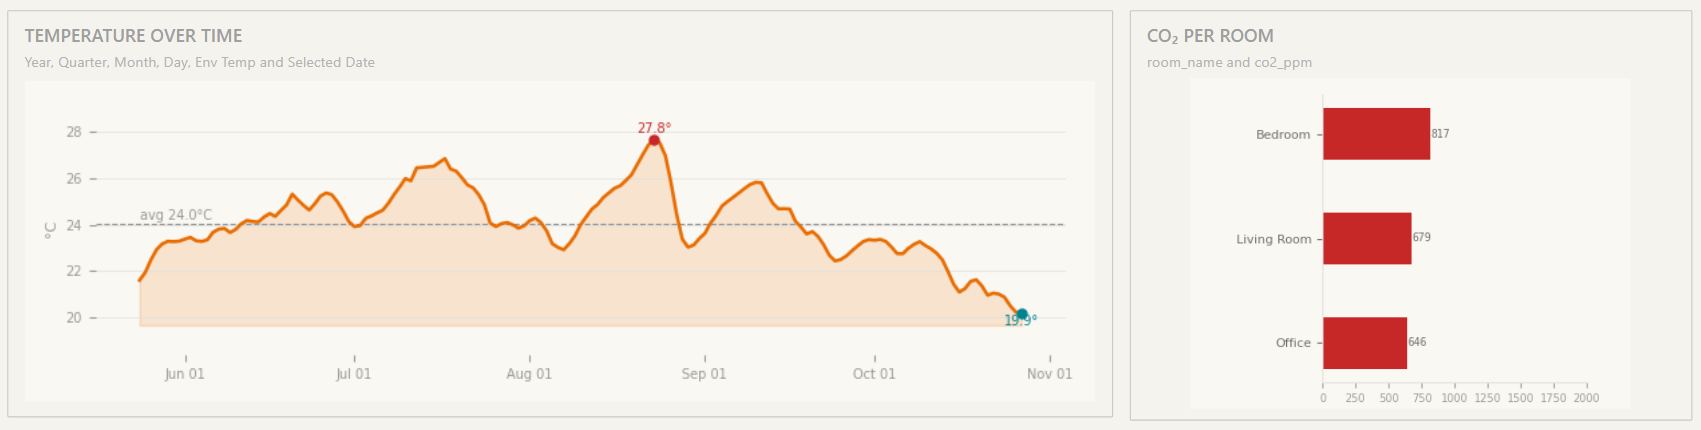
Environment — temperature over time
Smoothed daily average across rooms, period average dashed, hottest day highlighted. CO₂ per-room bars on the right surface ventilation issues.
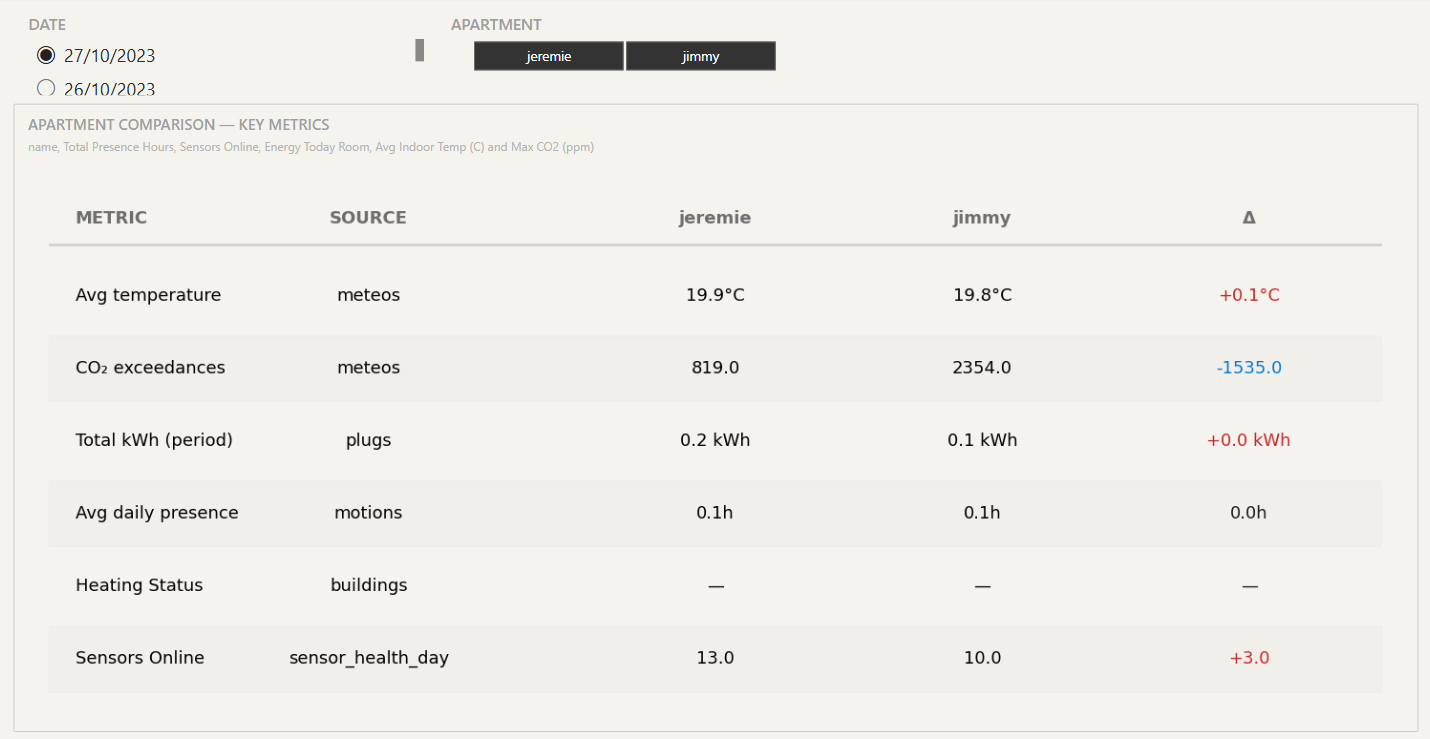
Compare — admin-only
Side-by-side apartment comparison with per-metric Δ. Visible only to the admin role — the two tenant roles literally cannot reach this page.
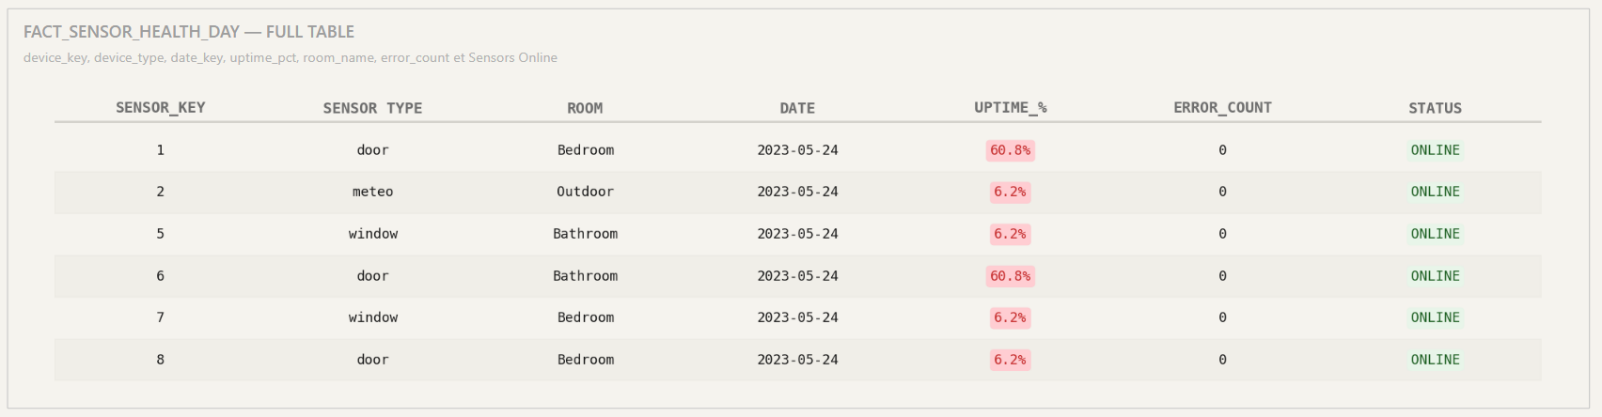
Device Health — sensor reliability
Every sensor with its type, last seen date, uptime, error count, online/offline. The maintenance-window view.
470k+
sensor files ingested
15M+
rows in Silver
7
Gold dimensions
2
smart apartments
~6s
watcher cycle
7
Gold fact tables
the challenge
Smart apartments generate massive amounts of data
Every minute, each apartment produces a JSON file containing readings from plugs, motion sensors, door/window sensors, meteo stations, humidity sensors, and consumption meters. Over 10 weeks, that’s 470,000+ files and 15 million sensor readings.
Raw data is useless without a pipeline
Nested JSON, inconsistent room names, outlier values, missing readings, sentinel values. The data needs to be ingested, cleaned, normalized, aggregated, and structured into a star schema before BI tools and ML models can consume it.
what we deliver
Four analytics domains
Energy Monitoring
Track power consumption per device, per room, per apartment. Watt-hour to kWh conversion, cost estimation, anomaly detection.
fact_energy_minute
Environment Tracking
Temperature, humidity, CO2, noise, atmospheric pressure. Window and door status. Indoor climate quality at a glance.
fact_environment_minute
Presence Detection
Motion sensors and door activity combined into a presence signal per room. ML-ready for predictive occupancy models.
fact_presence_minute
Sensor Health
Battery levels, uptime tracking, error detection. Know when a sensor is failing before it stops reporting.
fact_device_health_day
the pipeline
Medallion architecture
Data flows through five stages, each adding structure and value. Every script is idempotent and resume-capable — interrupt and re-run safely at any point.
SMB share (sensor JSON, every minute), MySQL (static metadata, 10 tables), sFTP (weather CSV, daily)
470k+ JSON files stored in timestamped folder structure. Never modified, always auditable.
15M+ rows in PostgreSQL. Deduplicated, normalized, outliers flagged. Watermark-based incremental processing.
Star schema with minute-grain fact tables. 7 dimensions, 7 facts. Optimized for BI and ML consumption.
Power BI dashboards and KNIME prediction models. Row-level security per apartment.
get started
Deploy in minutes, maintain with confidence
Whether you’re a building manager or a data engineer, we’ve got you covered.
Quick Install
availableNo technical knowledge required. Fill in a web form, download a single self-contained Python installer, run it once. Ten phases, auto-configured Power BI, KNIME workflows ready to fire on first launch.
open the install wizard →Developer Setup
availableFull control. Clone the repo, configure your .env manually, run each script step by step. 10 commands from zero to a running pipeline. Detailed setup guide included.
view setup guide →the team
Group 14
Dehlya
Data Engineer & Architect
Pipeline, Gold layer, website, orchestration, deployment
Sacha
Data Engineer
Weather ingestion, BI dashboards, security
Johann
Data Analyst & Scientist
ML models (KNIME), Power BI reports, user guide
HES-SO Valais / Wallis — Haute Ecole de Gestion — 64-61 Data Cycle — 2026
explore
Documentation
Architecture, data models, pipeline workflows, schemas
Pipeline Flows
Step-by-step ETL from Sources to BI
Technical Doc
Self-contained reference for IT specialists
Scrum
Sprints, meetings, agreements, team principles
Dashboard Mockups
Interactive Power BI prototypes with RLS
Resources
GitHub, Notion, tools, external links